Standard Deviations and Confidence Intervals
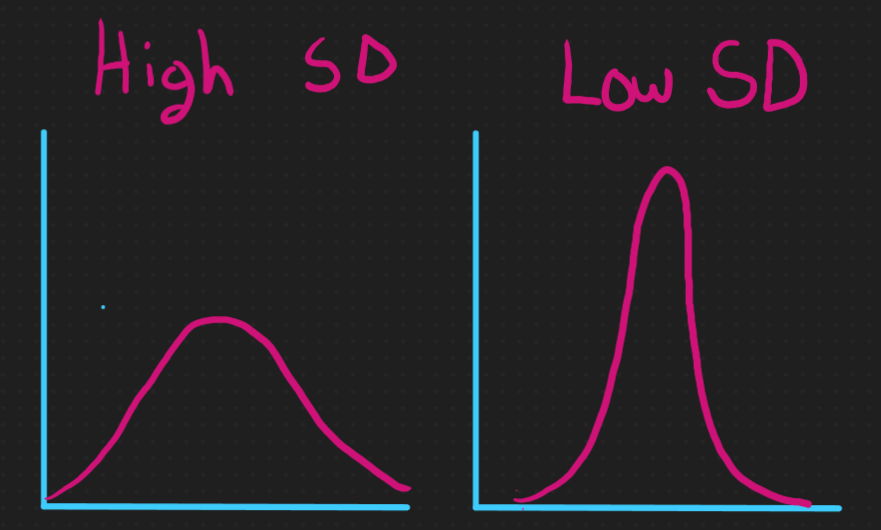
The standard deviation is a measure of variation in a set of data. It tells you, on average, how far away each data point is from the mean. A larger standard deviation means that the data is more spread out, while a smaller standard deviation means that the data is more tightly packed around the mean.

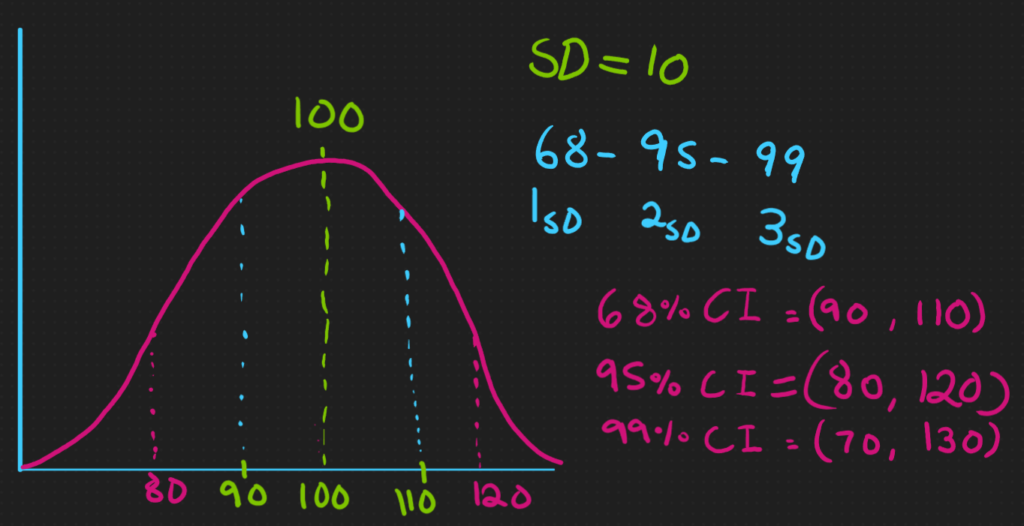
Under a normal distribution, we can use the 68-95-99 rule to understand how much of our data is captured under the standard deviation. From 1 standard deviation in each direction from the mean, 68% of our data is captured, 95% is captured under 2 standard deviations, and 99% of our data is held under 3 standard deviations away from the mean.
Note: Technically the 68-95-99 rule is actually 68.27% of data lies within 1 standard deviation of the mean, 95.45% within 2, and 99.73% within 3. We are rounding here for the sake of clarity. In most scenarios, those extra few tenths of a percent are not very impactful.
Standard deviation is commonly used in statistical analysis to assess the variability of a data set. It can also be used to calculate confidence intervals, which are a range of values that is likely to contain the true value of a population parameter with a certain level of confidence. For example, a 95% confidence interval for a population mean would imply that if we were to take many samples from the same population and calculate the mean from each sample, 95% of those sample means would fall within the confidence interval.

In R, we use the function sd() to calculate standard deviation!

