Branches
What are branches?

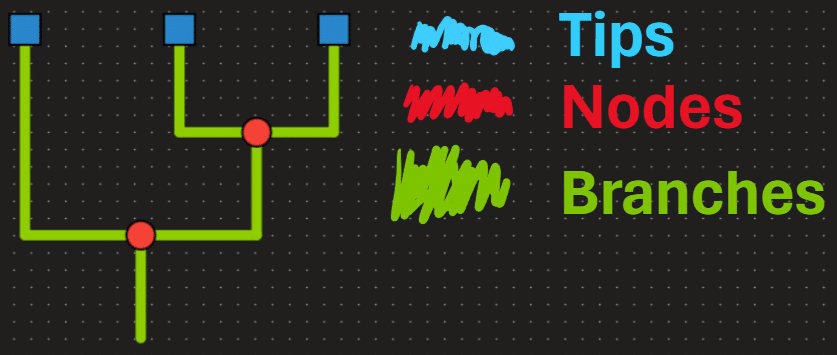
Branches connect tips to the internal nodes. They also connect internal nodes to one another.
These connections represent relationships between the taxa. In our below example phylogeny, the branches are highlighted in Green.

In most phylogenies, the length of the branches represents some form of distance between the tips. For example, if you’ve heard “Time Calibrated Phylogeny”, that is a phylogeny who’s branches are representing time (also known as a chronogram). For example, this study of ~8,000 genera of angiosperms, provides a time calibrated phylogeny.
Another common type of phylogeny you’ll see are phylograms, which are calibrated according to genetic distance. These branch lengths tell us how much evolutionary divergence there is between our tips. You can often spot these as the tips don’t line up at the end. This study on sexual selection in Central American Fishes, provides 3 genetic distance phylogenies.
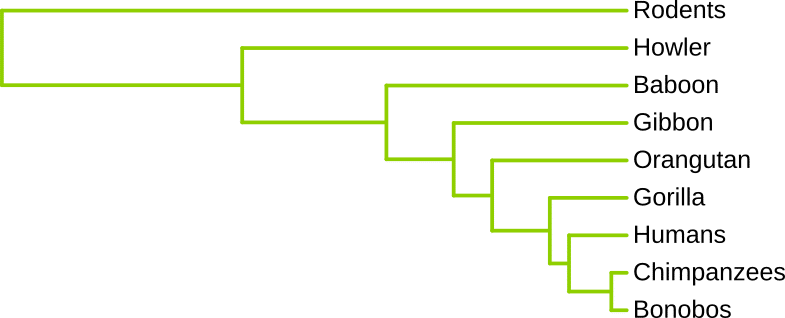
The last type are simple Cladograms. These are phylogenies whos branch lengths mean nothing. These are really useful for looking at relationships between species without the extra information contained within branch lengths. This is often used to illustrate relationships, or in situations where genetic material is unavailable. For example, this study on therapod dinosaurs provides a cladogram based on the structure of fossilized teeth enamel.
Each has their purpose, and many studies will provide multiple phylogenies for the group under question!

